This data is from the SPIVA New Zealand Scorecard. Produced by the S&P Dow Jones Indices, the SPIVA Scorecard compares actively managed funds to their indexed benchmarks.
The data is overwhelming clear. For the average retail investor, you have a strong chance of not picking the lucky fund manager and even if you do, over 10+ year periods of time the funds tend to underperform their index benchmarks.
This is one of the reasons why I advocate for the New Zealand investor to invest in a low-cost, automated, diversified, and simple manner.
Look at the SPIVA report for yourself
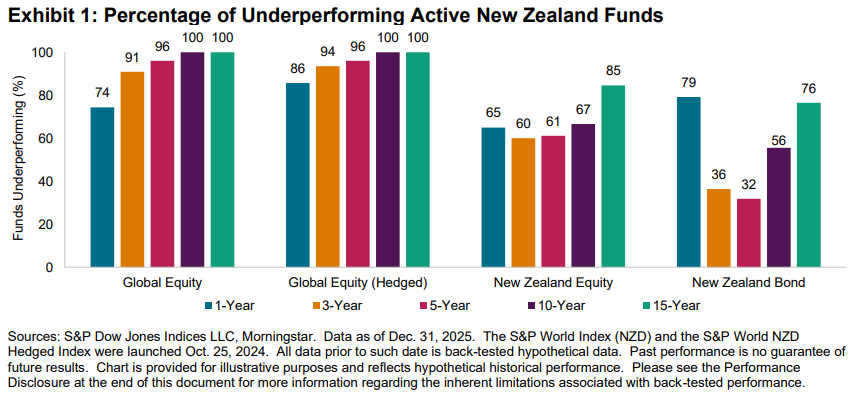
100% of New Zealand actively managed funds underperformed over 10 and 15 year time periods.
The report says: “Over the 10- and 15-year periods, all (global equity) funds underperformed in both hedged and unhedged categories.”
79% of New Zealand actively managed bond funds couldn’t beat the index over a 1 year time period.
The data is clear. Passive investing is better for the average retail investor. If you’re reading this page, that’s you.
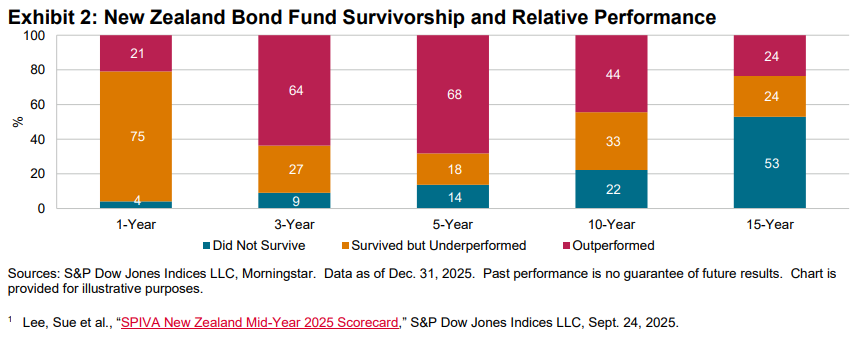
You can’t even guarantee that an actively managed fund will continue to exist. Over the last 15 years, over 52% of NZ bond funds didn’t survive.
SPIVA Scorecards are rooted in the following principles:
- Survivorship Bias Correction: Many funds might be liquidated or merged during a period of study. However, for someone making an investment decision at the beginning of the period, these funds are part of the opportunity set. Unlike other commonly available comparison reports, SPIVA Scorecards account for the entire opportunity set— not just the survivors—thereby eliminating survivorship bias.
- Apples-to-Apples Comparison: Fund returns are often compared to popular benchmarks such as the S&P 500®, regardless of size or style classification. SPIVA Scorecards avoid this pitfall by measuring a fund’s returns against the performance of a benchmark appropriate for that particular investment category.
- More than Just Underperformance Rates: As well as the most quoted statistics of percentage underperformance rates, SPIVA Scorecards also include additional data on average fund returns, quartile ranges, survivorship rates and other factors—including the market context—to offer a robust perspective on active performance.
- Data Cleaning: SPIVA Scorecards avoid double-counting multiple share classes in all count-based calculations, using only the share class with greater assets. Since this is meant to be a scorecard for active managers, it excludes index funds, leveraged and inverse funds and other index-linked products.